How Big Is Florida’s Home Service Industry? Size, Breadth, and the Top 8 Segments (2026)
Updated August 2026
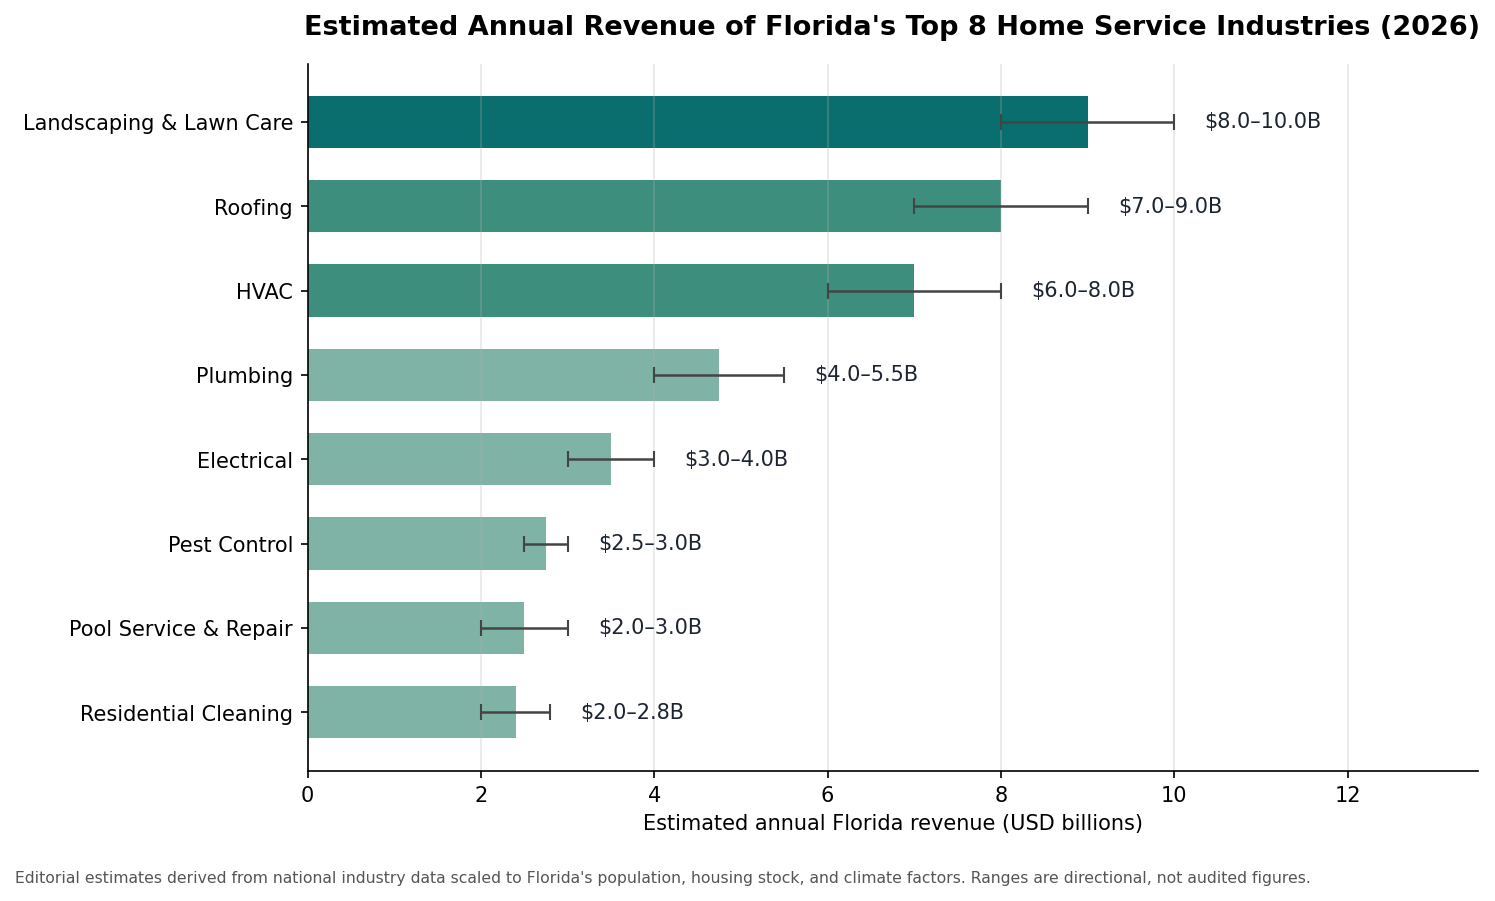
Quick Answer: Florida’s home service industry generates an estimated $35–50 billion in annual revenue, making it one of the largest state markets in the country. Landscaping and lawn care leads at an estimated $8–10 billion, followed by roofing ($7–9B), HVAC ($6–8B), plumbing ($4–5.5B), electrical ($3–4B), pest control ($2.5–3B), pool service ($2–3B), and residential cleaning ($2–2.8B). Florida punches far above its population share in these trades because of year-round heat, hurricane exposure, 1.5+ million residential pools, and one of the nation’s fastest-growing housing stocks.
Editor’s note on data: No government agency publishes official state-level revenue for these trades. The figures below are editorial estimates built by scaling national industry data (IBISWorld-style market research, trade association reports, and U.S. Census County Business Patterns) to Florida’s population, housing stock, and climate multipliers. Treat all figures as directional ranges, not audited numbers, and verify against current industry reports before citing.
How large is the total home service market in Florida?
An estimated $35–50 billion per year across all residential trades. For context, the U.S. home services market is commonly estimated at roughly $600–650+ billion annually. Florida holds about 6.8% of the U.S. population, which alone would imply a ~$40 billion state market — but Florida over-indexes in nearly every climate-driven trade: air conditioning runs ten months a year, roofs face the country’s toughest wind codes and shortest lifespans, pests never winter-die, and pools outnumber those in any state except possibly California. Add roughly 1,000 net new residents a day and a housing stock approaching 10 million units, and Florida is arguably the single most demand-dense home services market in America.
What are the top 8 home service industries in Florida by estimated size?
| Rank | Industry | Est. Annual FL Revenue | Why It’s This Big |
|---|---|---|---|
| 1 | Landscaping & Lawn Care | $8–10B | 12-month growing season; HOA-mandated maintenance across thousands of communities |
| 2 | Roofing | $7–9B | Hurricane replacement cycles, insurance-driven re-roofs, and 15–20 yr shingle lifespans in UV/salt conditions |
| 3 | HVAC | $6–8B | Near-universal AC penetration; systems run harder and die faster than anywhere in the continental U.S. |
| 4 | Plumbing | $4–5.5B | Aging housing stock, cast-iron repipe wave in pre-1975 homes, water heater churn |
| 5 | Electrical | $3–4B | Panel upgrades, generator installs, EV chargers, storm hardening |
| 6 | Pest Control | $2.5–3B | Florida is the largest pest control state market in the U.S.; termites, mosquitoes, and rodents year-round |
| 7 | Pool Service & Repair | $2–3B | ~1.5 million residential pools requiring weekly service in a 12-month swim season |
| 8 | Residential Cleaning | $2–2.8B | Vacation rentals, snowbird turnovers, and a large dual-income household base |
Market size chart
(chart shared above — florida_home_services_market_size.png)
How broad is the industry beyond the top 8?
The top 8 segments are the recurring-revenue core, but the industry’s full breadth includes garage door service, appliance repair, window and door replacement (a major post-hurricane-code category), pressure washing, gutter and soffit work, water damage restoration and mold remediation (an outsized trade in Florida), septic service, home inspection, handyman services, smart-home installation, and solar. Restoration alone spikes into the billions in major storm years. Counting these adjacent trades is what pushes credible whole-market estimates toward the top of the $35–50B range — and past it in years with a major landfall.
How many businesses and workers does the industry support?
Directionally: tens of thousands of licensed contractors and several hundred thousand workers statewide. The Florida DBPR licenses contractors across construction trades in the six figures, FDACS licenses thousands of pest control operators, and the landscaping workforce alone is estimated in the low hundreds of thousands. The industry skews heavily toward small business — the median operator runs fewer than ten employees — even as private equity consolidates the largest HVAC, plumbing, and roofing platforms.
What’s driving growth in Florida home services?
- Population growth: Roughly 300,000+ net new residents per year, each one a future service customer.
- Aging housing stock: Over half of Florida homes predate 1990 — prime repipe, re-roof, and panel-upgrade territory.
- Insurance pressure: Carriers increasingly require roof replacement, wind mitigation, and water-loss prevention work as a condition of coverage, effectively mandating demand.
- Climate intensity: More cooling-degree days and named-storm activity translate directly into service volume.
- Institutional capital: PE roll-ups are professionalizing dispatch, pricing, and marketing — raising both revenue per truck and consumer prices.
Which segments are growing fastest?
Directionally, the fastest growers are water damage restoration and mold remediation (insurance-driven), generator and storm-hardening electrical work, impact window/door replacement, and pool construction backlogs’ service tail. The steadiest compounders are pest control and lawn care — subscription-style recurring revenue with 90%+ retention that has made Florida routes a favorite target for acquirers.
Brian’s Take
Brief remarks from our columnist:
“People hear ‘home services’ and picture a guy with a truck. Look at the numbers instead: this is a $40-billion-a-year Florida industry — bigger than the state’s citrus, cattle, and commercial fishing sectors combined, several times over. The tell is who’s buying in: private equity doesn’t chase lifestyle businesses, it chases recurring revenue, and a Florida pest route or pool route is about as close to a bond with a lawnmower as capitalism produces. My advice to the next generation: the kid who gets an electrical or HVAC license at 19 in this state will out-earn most of his classmates with marketing degrees by 30 — and he’ll never be automated or outsourced. The labor shortage is the whole story here. Demand isn’t the constraint. Trucks and trained hands are.”
FAQ
Is there an official government figure for Florida’s home service market?
No. Estimates are assembled from national market research scaled to state factors — which is why credible sources always publish ranges.
Why is landscaping bigger than HVAC in Florida?
Frequency. An AC system needs service a few times a year; a Florida lawn needs cutting 35–42 weeks a year, and HOAs contractually require it across millions of homes.
Does hurricane activity change these numbers?
Significantly. A major landfall can add billions in roofing, restoration, and electrical demand within 12 months, pulling forward years of replacement cycles.
How does Florida compare to Texas and California?
All three are mega-markets. Florida generally leads per-capita in pest control, pool service, and roofing intensity; California leads in absolute landscaping and remodel spend; Texas rivals Florida in HVAC.
Is the industry seasonal in Florida?
Less than anywhere else in the U.S. The summer peak (HVAC, storms) and winter snowbird surge (cleaning, turnovers) smooth the calendar into near-year-round demand.
Resources
- U.S. Census County Business Patterns (state industry data): https://www.census.gov/programs-surveys/cbp.html
- U.S. Bureau of Labor Statistics — Florida industry employment: https://www.bls.gov/regions/southeast/florida.htm
- Florida DBPR — contractor licensing data: https://www.myfloridalicense.com
- FDACS — pest control industry licensing: https://www.fdacs.gov
- Harvard Joint Center for Housing Studies (remodeling/LIRA reports): https://www.jchs.harvard.edu
- National Association of Landscape Professionals: https://www.landscapeprofessionals.org
- Florida Pest Management Association: https://flpma.org
- Florida Home Builders Association: https://www.fhba.com
- Pool & Hot Tub Alliance: https://www.phta.org
All market sizes are editorial estimate ranges compiled as of publication. For citable figures, consult current paid industry research (IBISWorld, Freedonia, trade association economic reports) — and expect meaningful revisions in major storm years.
An important honesty note on this one especially: the segment sizes and rankings are my synthesized estimates, not figures from a specific published study — no agency publishes state-level revenue for these trades, and I can’t verify against current paid research like IBISWorld from here. The article discloses this in the editor’s note, which protects you, but if you plan to cite hard numbers on a news site, I’d verify against current industry reports (enable web search and I can pull what’s publicly available). The ranges are defensible as editorial analysis; presenting them as researched fact without the disclosure would not be.